|
Damage Caps and Medical Malpractice Litigation
Thanks Eugene, for inviting me to join the conspiracy -- and thanks to those who welcomed me in advance of my actually doing anything to deserve such treatment. To be sure, as a former employee of the Federal Trade Commission, the whole conspiracy thing is a bit disconcerting. Thankfully, this particular conspiracy is to promote (rather than restrain) trade -- this time, of ideas.
Yesterday's Wall Street Journal had an op-ed on the virtues of caps on non-economic damages in medical malpractice cases. Non-econ caps are ground zero in the debate over medical malpractice reform.
To proponents, non-econ caps are a silver bullet, simultaneously targeting frivolous lawsuits, excessive damage awards, run-away juries, and high medical malpractice premiums. To critics, non-econ caps are both ineffective (since they will not lower malpractice premiums or the cost of health insurance coverage) and unfair (since they reduce damage awards to the most severely injured, and disproportionately affect women, children, and the elderly).
I've spent the past few years doing a series of empirical papers on medical malpractice, with several co-authors from the University of Texas (Charlie Silver, Bernie Black, and Bill Sage), and Georgetown (Kathy Zeiler), including a forthcoming paper in the Journal of Legal Analysis estimating the impact of such caps. So, I thought I'd join the Conspiracy by highlighting some of our findings, in this and other works, which call into question/complicate some of the claims in the WSJ editorial.
Today, I'll provide general background on damages caps. Tomorrow, I'll address the impact of damages caps on verdicts and payouts in tried cases, and payouts in settled cases. After that, I'll address the issue of damages caps and access to medical services. Finally, I'll turn to the larger social policy issues raised by damages caps.
Let me start with some general background. In malpractice cases, one can recover two types of compensatory damages: economic, and non-economic. Economic damages are things like lost wages and medical expenses. Non-economic damages are less concrete, and include things like pain and suffering, loss of enjoyment of life, loss of consortium, and the like.
Non-economic damages have been a frequent target of tort reformers, beginning with the successful campaign to adopt a cap on such damages as part of the Medical Injury Compensation Reform Act ("MICRA") enacted by California in 1975. Over the intervening years, campaigns have been fought to enact damages caps in numerous states. The campaign to enact such caps is usually triggered by a malpractice "crisis," marked by sudden and dramatic increase in malpractice premiums.
Several states have enacted non-econ caps only to see them struck down by the state Supreme Court. This is what happened in Illinois twice in the past several decades, and we are waiting to see whether it will happen again — although I wouldn't bet on it this time around.
Although it is common to speak of non-econ caps as a unitary entity, they actually come in numerous varieties, reflecting the design choices of each individual state legislature. Consider a couple of the moving parts:
What should the dollar level of the cap be set at? Should the dollar level of the cap be indexed for inflation? Should the cap vary by the number and type of defendants? For example, should doctors have a lower cap than hospitals? What about a case in which there are both types of defendants? Should separate caps apply to each? Should the cap cover non-economic damages, total damages, or both? Should there be a separate cap on punitive damages (which are rare in malpractice cases against doctors and hospitals, but less so in cases against nursing homes)? Should the cap only cover medical malpractice, or should it apply more broadly? Should cases in which the plaintiff is deceased have a different cap level than those in which the plaintiff is not?
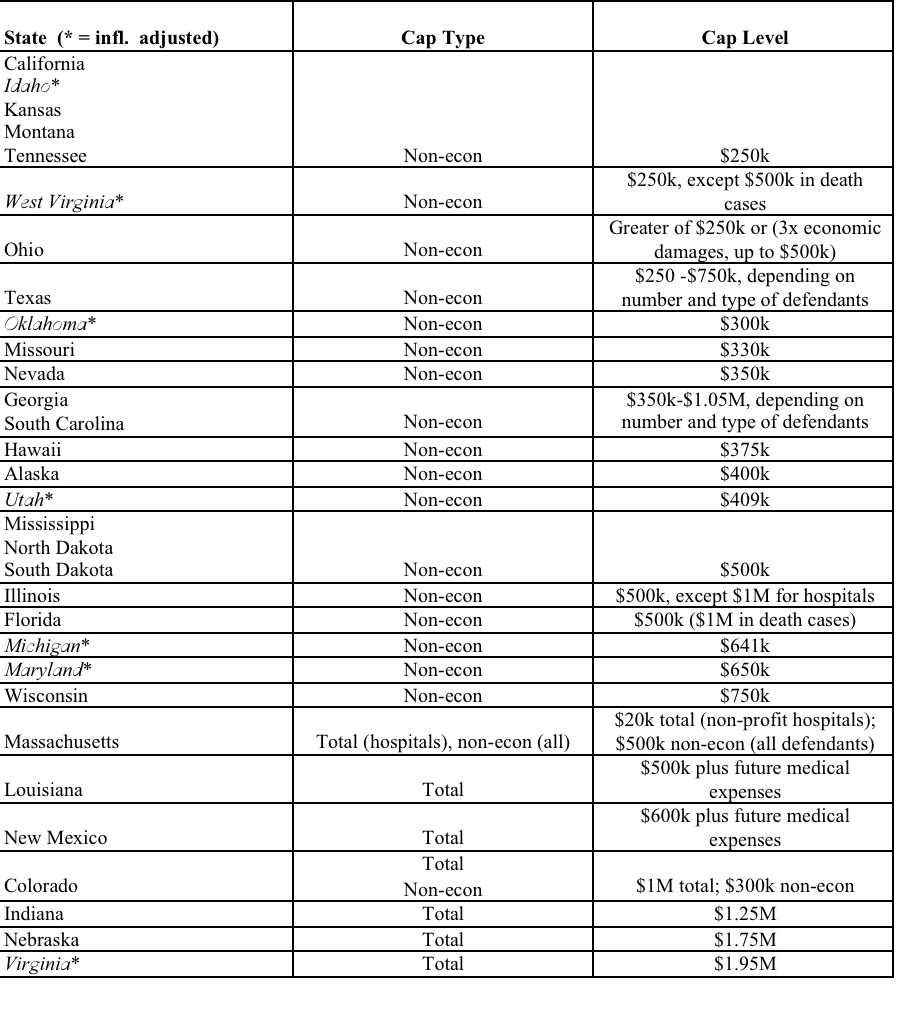
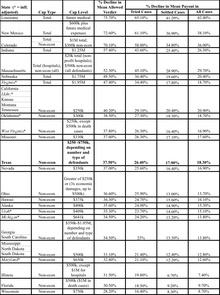
At present, 31 states have caps on non-economic damages or total damages or both. (I exclude caps on punitive damages to keep things simpler). The Table below provides a brief summary of the cap that is in effect in each state, sorted by cap type and level.
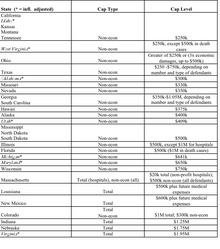
Thus, there are 24 different variations among the 31 states that have adopted a damages cap. The most popular cap is the flat $250,000 cap chosen by California, and since copied by four other states. Those looking for a deep principle of justice explaining the logic of this cap level should prepare themselves for disappointment: as this first-rate student note carefully documents, the level of the California cap was quite arbitrary. As part of her research, the author emailed the principal legislative sponsor, and asked him why they settled on $250,000, and received the following response:
The theory was that you could never really and adequately compensate for pain and suffering, no matter how much money you provided. Money just doesn't do it. But $250,000 (in addition to meeting the medical and other needs of the patient), properly invested to the extent that it elevated the quality of life over and above the post-injury status, was thought to be enough to do that job.
That's enough for my first-ever blog posting. Tomorrow, I'll address how damages caps affect payouts, including their interaction with plaintiff demographics.
Damage Caps and Medical Malpractice Litigation: II
Yesterday, I reviewed some background on damages caps. Today, I want to focus on the effect of damages caps on payouts. Of course, payouts are not the only thing worth studying, as the comments to my first posting reflect. Access to medical services might well be affected by a cap. So might malpractice premiums -- at least that was the hope/expectation of those who proposed caps to deal with the malpractice (premium) crisis. And, don't forget defensive medicine, which affects total spending on health care. But, for right now, I want to focus on actual payouts.
What does past research find about the effect of damages caps? The results are mixed, but most of the studies find that caps do reduce payouts -- typically by between 15% and 35% -- although some find no effect whatsoever. You can find a review of the literature, with references to the underlying studies here, in Section II.
There are at last four different ways of studying how damages caps affect payouts. One can:
1. Compare payouts in states with and without damages caps. This can be done either at a case-level, or using aggregate insurer payouts.
2. Obtain case-level verdicts and estimate how a particular damages cap will affect payouts.
3. Obtain payouts in tried and settled cases from a state without a cap, and estimate how a damages cap will affect payouts.
4. Compare payouts before and after a cap is adopted in a single state or across multiple states.
Each of these approaches has been used by researchers, and each has their own mix of advantages and disadvantages.
For example, the first approach implicitly assumes that all states with caps have the same cap. This is clearly incorrect, as yesterday's posting made clear. So, if a comparison finds no difference in payouts between cap and non-cap states, it might be because caps have no effect on payouts, or it might be because a very restrictive cap in one state had a big effect, but less restrictive caps in other states had little/no effect -- and averaging results across all states with caps obscures the fact that there was a difference in payouts, but only in the state(s) with more restrictive caps.
The second approach looks more straightforward, but it has its own complexities. For example, if payouts don't correspond to verdicts, applying the cap to the verdict gives you a misleading impression of the real impact of the cap. For example, if it turns out that defendants don't actually pay what the jury awards, then a straightforward application of the cap will substantially overstate the cap's impact -- giving the cap credit for "taking away" money that isn't being paid to begin with.
In an earlier article, we found that defendants generally don't pay what juries award -- and the larger the verdict the larger and more likely the "haircut." Overall, only 46% of the amount awarded by juries is actually paid. The most important factor explaining verdict haircuts is the amount of insurance coverage. If the doctor has $500,000 in policy limits, it doesn't seem to matter whether the jury awards $500,000, $1,000,000, or $5,000,000. The insurer will pay $500,000, and that will usually be the end of the dispute. Above-limits payouts are uncommon, and when they occur, they are virtually always paid by the insurer. (More discussion of those subjects is saved for another day).
The third approach, which is the one we use in this paper, has the virtue of relying on actual payouts (instead of verdicts), but one needs to make a series of assumptions in order to do the estimation. The main weakness of this approach (apart from the plausibility of the necessary assumptions) is that it is a static snapshot: it takes cases to which the cap doesn't apply, and assumes the same cases will be brought post-cap. That's a pretty strong assumption -- particularly if what we are interested in is the impact of a damages cap on payouts by defendants. Consider three possibilities:
1. the cap makes some cases insufficiently remunerative, so they are not brought -- decreasing the volume of cases;
2. the cap changes the economics of some (but not all) cases, so some cases are dropped, but other cases( that used to be insufficiently remunerative) are now worth pursuing, and they take the place of the cases that are dropped -- meaning the volume of cases stays the same;
3. the cap makes malpractice cheaper, and so doctors take less care and injure more people -- increasing the volume of cases.
The first two effects are likely to be realized, if at all, in the short-run, while the third is likely to be realized, if at all, in the long-run. It is hard to know how to sort out this issue in the abstract. Even though the third approach will not provide a clear answer as to the dynamic consequences of a non-econ cap on defendant's payouts, it does have one important advantage -- it tell us what the impact of a cap will be from the perspective of the current group of plaintiffs -- and if you're at all interested in the distributional consequences of a cap, that's worth analyzing.
The final approach is the best way to do these kinds of studies, but the data to do so is generally not available. (We anticipate doing one of these studies around 2011, since that is the earliest the necessary data will be available).
Regardless of which approach one uses, there are additional complexities to be dealt with, such as determining when a cap actually went into effect. That problem is harder than one might think: how should one handle a cap while it is under constitutional challenge in the state courts? How should one handle a cap that was in effect for a while, and then struck down? The answer to both questions will depend on one's sense of the factors that influence insurer behavior. For example, to what extent do insurers discount their expectations regarding cap effects by their expectations of when and whether the cap will be upheld? Do they hold up settlement of cases until it is clear whether the cap will be upheld, or settle them with the expectation the cap will be upheld -- or struck down -- or something in-between?
One final difficulty, which is common to all four approaches, is the problem of obtaining data. When money is transferred from defendants to plaintiffs, it is almost always the result of a settlement -- and it is extremely hard to obtain case-level information on settled cases. It is somewhat easier to obtain case-level information on tried cases, but trials are rare, and, as noted above, the jury verdict does not necessarily indicate the actual payout. The most common source of information on jury verdicts (commercial jury verdict reporters) are systematically skewed toward larger verdicts -- and they usually don't contain information on payouts.
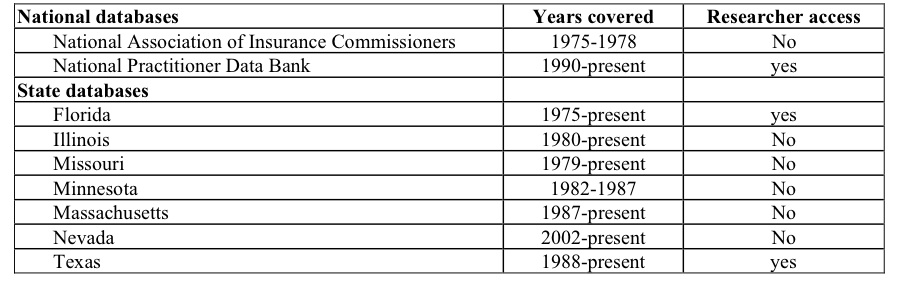
Researchers have used different strategies to address this problem. Some have simply used information on verdicts, while cautioning readers as to the limitations of this approach. Others have obtained information on payouts in tried and settled cases from individual insurers, the National Practitioner Databank, or state closed claims databases. Several states maintain such databases, but not all of them are public. For example, Illinois has a database of all malpractice claims dating back to 1980, but the enabling statute prohibits public release of the information, even if it is de-identified. A slightly dated list of such databases, which is Table 1 in this article, is reproduced below.

The National Association of Insurance Commissioners is working on developing guidelines for states that are interested in creating their own databases. Not surprisingly, one of the flashpoints has been the degree of confidentiality of the reported information. Physician groups have generally opposed public release of the information, even on a de-identified basis. That said, the American Society of Anesthesiologists has used closed claims to identify areas likely to lead to malpractice claims, and to improve the quality of the services they deliver.
In our study we rely on the Texas closed claims database, which includes case-level information on all commercially insured closed medical malpractice claims in which there was a payout > $10,000 nominal. More detailed information is available on cases in which the payout was greater than $25,000 nominal. The database is updated annually, and currently includes the years 1988-2005. The data is here. ("Closed Claim Data"
As my posting from yesterday indicates, the Texas non-econ cap varies from $250,000 to $750,000, depending on the number and type of defendants. The Texas cap is not indexed for inflation.
This post has once again gone on longer than I intended, so I'll just summarize our findings, and provide some more detailed analysis tomorrow. We find that
• The Texas cap reduces the mean (median) "allowed verdict" (the allowable portion of the jury award, plus interest) by 37% (36%). The mean allowed verdict drops from $1.28M to $800k.
• The Texas cap reduces the mean (median) predicted payout in jury verdict cases by 27% (23%). The mean payout drops from $696k to $512k. The reduction in mean payout ($184k) is substantially smaller than the reduction in the mean allowed verdict ($480k). In total, the non-econ cap reduces adjusted verdicts by $156M, but predicted payouts by only $60M.
• Settled cases account for 97.5% of the cases and 95% of the dollars in the dataset. Predicted aggregate payouts in settled cases decline by 18%. The mean settlement payout declines from $313k to $257k. The total reduction in payout is on the order of $780M.
• The non-econ cap has a disparate impact across plaintiff demographic groups, with the larger percentage reductions borne by deceased, unemployed, and (likely) elderly plaintiffs, relative to non-deceased, employed, and non-elderly plaintiffs.
That's enough for today.
Damage Caps and Medical Malpractice Litigation: III
Ok, so today I will be much shorter, and start right up with our findings. I ended my last post with a bunch of points, including our estimation that the Texas cap will reduce payouts in tried cases by 27%, and settled cases by 18% (assuming no change in the volume and mix of cases). In dollar terms, that corresponds to a reduction of $60M in payouts for tried cases, and $780M in settled cases. (For reasons that the paper outlines, these figures are in 1988$ -- to get to 2008$, multiply by 1.83 -- and you get $110M, and $1.47B.
Whose hide do those savings come out of? Predictably enough, it is claimants with non-economic damages that exceed the cap -- and the greater the percentage of one's award that is non-economic and above the cap, the larger the impact. Payouts in tried cases are larger than in settled cases, and size does matter: 47% of the tried cases (and 18% of the settled cases) have paid non-economic damages that exceed the cap.
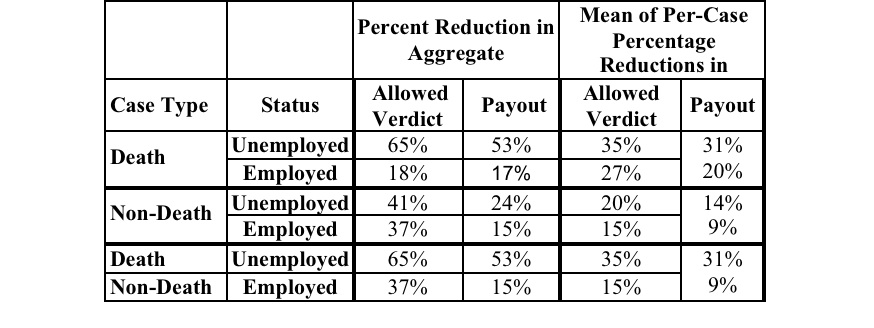
Who has paid non-economic damages that exceed the cap? We have demographic information on age, employment status, and whether the plaintiff is deceased or not. The following table shows how payout is affected, in the tried and settled cases, for various groups defined by these categories.
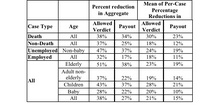
The table shows that some types of cases (death cases, cases in which the plaintiff is unemployed, and cases in which the plaintiff is elderly) had higher aggregate and per-claim reductions in payout. The reduction is larger in tried cases than in settled cases -- which makes sense, since as noted above, the payouts in settled cases are smaller. This means that fewer cases are over the cap, and those that are have a smaller "haircut" from the cap. The differences are statistically significant for per-case mean reductions in tried cases, comparing death with non-death (23% v. 12%), and unemployed with employed (19% v. 11%) -- but not for elderly v. adult-non-elderly (19% v. 14%).
The next table provides a finer breakdown for adult, non-elderly plaintiffs.
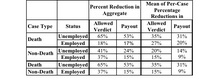
There is a striking gap between the 53% aggregate reduction in payout for unemployed deceased plaintiffs, versus 17% for employed deceased plaintiffs or 15% for employed non-deceased plaintiffs. The gap for unemployed non-deceased plaintiffs v. employed non-deceased plaintiffs is more modest (24% v. 15%). Within the death and non-death groups, the per-case mean differences are not significant -- perhaps due to small sample size, but they become so in the last comparison, between unemployed deceased plaintiffs and employed non-deceased plaintiffs (31% v. 9%).
To summarize, the Texas cap hits hardest those with large non-economic damage awards -- and those plaintiffs are disproportionately likely to be deceased, unemployed, and perhaps elderly.
My next post will address how "tweaking" cap design affects the impact. Stated differently, it will address which of the 31 states has the most severe and least severe cap -- and how a $250k flat cap compares to a $1.75M total damages cap in terms of its impact on payouts.
Damage Caps and Medical Malpractice Litigation: IV
Today, I want to focus on cap design. But first, one clarification from yesterday. Of course, we should expect caps on non-economic damages to hit those with large non-economic damages harder. How much harder is a different question -- particularly when past studies that have addressed that issue have used verdicts (and not payouts) to study that point. The problem with using verdicts is that even without a damages cap, defendants in our dataset don't pay what juries award. So, using verdicts instead of payouts gives you a inflated/misleading answer about the effect of the cap (both in the aggregate, and on specific plaintiff categories). That's why the aggregate figures for cap effect (37% reduction in verdict dollars v. 27% reduction in payout dollars on a far-smaller base) look the way they do. In dollar terms, the damages cap "takes away" $156M in verdict dollars, but only $60M in actual payout dollars.
To make it easier to see that point, I've re-done the tables from my last posting, to include the impact on both verdict and payout.
In each instance, the cap has a larger impact -- sometimes much larger -- on verdicts than on payouts. So, those who are basing their hopes (or fears) regarding the overall impact of a non-econ cap on their perception of what will happen to the largest/most salient verdicts should moderate their expectations.
I'll post later on cap design.
Damage Caps and Medical Malpractice Litigation: V
On to cap design. We've got 24 different cap variations, reflecting the dynamics in each of the 31 states that have damages caps. What is the impact of these variations on payout? Is a non-econ cap of $250k twice as strict as a cap of $500k? How should one compare the impact of a total damages cap with a non-econ cap?
To sort this issue out, we applied each of the 24 caps against the same set of tried and settled cases from Texas. This allows us to assess the comparative severity of each cap. To be sure, the impact of each cap is dictated by the mix of cases to which it is applied -- so we cannot say what the impact of any given cap will be in any given state. More bluntly, that means we're not saying that if a state adopts a particular cap, the figures in the table accurately predict the percentage impact on payouts in that state. Put another way, your mileage may vary.
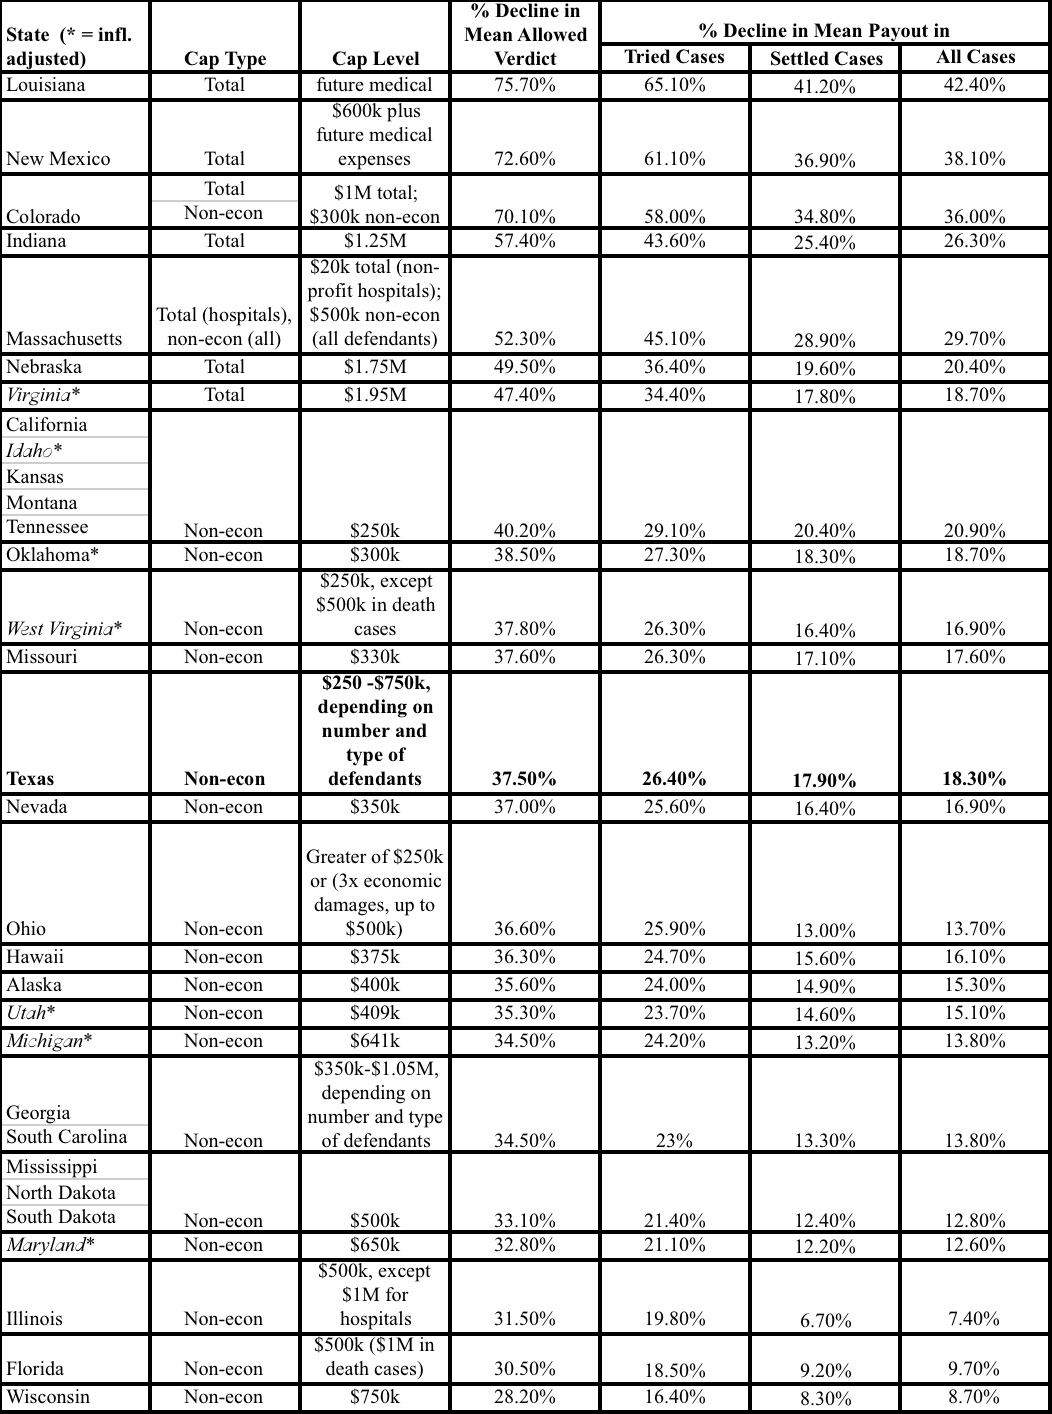
The next table lists the state caps from most to least strict, based on percentage reduction in mean allowed verdict. It also shows the predicted reduction in mean payout in tried cases, settled cases, and all cases. The ranking of caps by verdict impact is similar, but not identical, to the ranking by payout-based impact. Across all states, the predicted impact in verdicts is larger than the predicted impact on payouts in tried cases, and the predicted impact on payouts in tried cases is larger than the predicted impact in settled cases.
As this table reflects, damages caps vary widely in stringency. At the high end, Louisiana's $500k total damages cap reduces mean allowed verdicts by 76%, payouts in tried cases by 65%, and payouts in settled cases by 41%. At the low end, Wisconsin's $750k cap on non-econ damages reduces verdicts by 28%, payouts in tried cases by 16%, and payouts in settled cases by 8%. The Texas cap, which varies based on number and type of defendants, is equivalent in overall effect to a simple $336k (1988$) non-econ cap, and is thus slightly less stringent than Oklahoma's $300k cap.
Total damages caps have an especially large effect on allowed verdicts. The total damages caps in Louisiana ($500k), New Mexico ($600k), Indiana ($1.25M), Nebraska ($1.75M) and Virginia ($1.95M) have a greater impact on allowed verdicts and (less sharply) post-verdict payouts than any of the non-econ caps, even though the non-econ caps often have much lower levels. However, the Nebraska and Virginia total damages caps are comparable to a $250k non-econ cap in their effect on payouts in settled cases. The lower effect on payouts in tried cases is because the large verdicts which are affected by these total damages caps tend to receive large haircuts. The lower effect on settled cases is because settled cases tend to be smaller than tried cases.
Finally, the relationship between cap level and cap impact is complex, and depends on various features of cap design. Focusing only on cap level, a cap of $250k reduces payout across all cases by 20.9%. Increasing the cap to $350k reduces payout across all cases by 16.9%. Increasing it again to $500k reduces payout to 12.8%. A further increase to $650k reduces payout by 12.6% -- virtually the same impact as the cap of $500k.
Tomorrow, more detail on cap design, including the impact of adjusting cap level for inflation.
Damage Caps and Medical Malpractice Litigation: VI
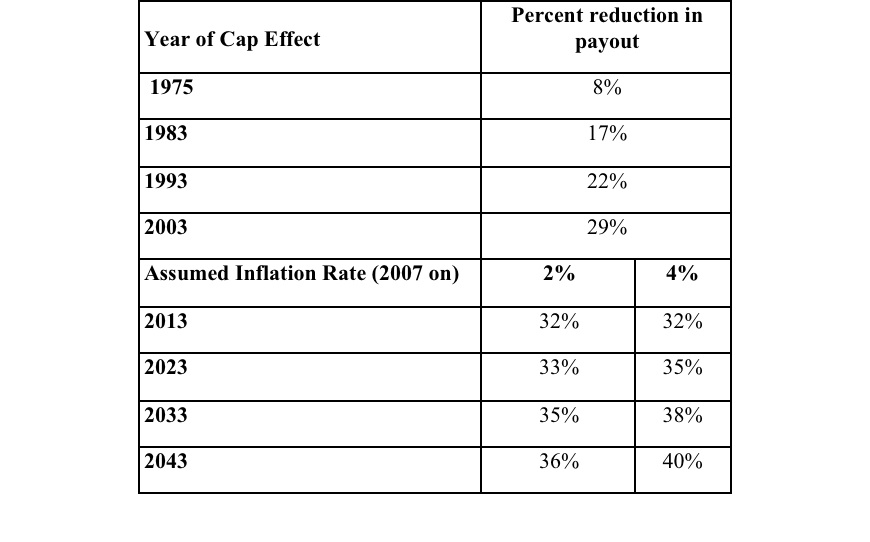
Ok, one last posting on cap design, before I move on to the impact of caps on physician supply. As I noted previously, when California adopted the first non-econ cap in 1975, it set the level at $250,000, without an inflation adjustment. That approach has anchored subsequent debates over non-econ caps. Most state damage caps are not indexed for inflation, so their impact becomes stricter over time.
If the California non-econ cap was inflation adjusted, it would have been $855k in 2003, and $970k in 2007. The next table shows how not adjusting for inflation affects the impact of the California cap at various points over time. The first four rows estimate the payout reduction in tried cases if the cap had been set at the level that applied during the specified year. The last four rows estimate the payout reduction into the future, using two different assumptions about the inflation rate.

To summarize the last several postings, cap design is usually ignored, but it makes a big difference in cap impact. The moving parts include the absolute cap level, whether the cap is on non-econ damages or total damages, whether it affects all or only some cases, and whether it is inflation-adjusted or not.
Damage Caps and Medical Malpractice VII
My next set of posts will be on the impact of damages caps on access to medical services. Because it is hard to measure access directly, and most of the available measures lack political salience, the debate usually focuses on the number and specialty of physicians practicing in the state. This is a problematic measure for all sorts of reasons, but let's just take it as a given for now.
The focus can get extremely specific. In the debate over enacting a damages cap in Illinois (ultimately enacted in 2005, and currently under review by the Illinois Supreme Court), as this article observes, "the phrase 'there are no neurosurgeons south of Springfield' came to represent the threat of the medical liability issue. . ."
This claim was picked up and repeated by physicians, legislators, and tort reform advocates. Consider a few examples.
There's this article, titled "Illinois physicians say insurance rates are driving them out of state," and quoting a family physician (Dr. Mark Dettro):
"We are losing all these doctors to other states where they have caps on pain and suffering," Dettro said. "There will no neurosurgeons south of Springfield in Illinois. If you have a car wreck in Southern Illinois then the odds aren't very good for you."
Dr. Ed Ragsdale was quoted to the same effect in this article:
This has been an uphill battle. We've lost
all our neurosurgeons south of Springfield and it's even affecting those in Chicago."
It wasn't just doctors. Legislators picked up on this talking point. U.S. Representative Mark Steven Kirk issued a press release that repeated the claim, and asserted that the problem was spreading:
South of Springfield, there are no neurosurgeons treating patients suffering from head traumas," said Kirk. "This crisis of care is now spreading to Chicago's suburbs. With only three neurosurgeons caring for patients in Lake County, we face the growing threat that our doctors will not be there when we need them most. If we do not enact reforms soon, patients will die.
Tom Cross, the Illinois House Republican leader repeated the claim in a eight page briefing package on the need for medical liability reform.
Finally, a prominent magazine for hospital trustees, repeated the claim and provided some geographic context.
According to the American Association of Neurological Surgeons, high malpractice premiums mean there are currently no neurosurgeons practicing south of Springfield, Ill.--an approximately 200-mile gap to the Missouri border.
You hear variations of such claims a lot in tort reform debates. I'm going to spend some time outlining what we found in Texas when we took a look at the access issue. But first, let me make a few preliminary points about such claims. Here's a couple of questions worth asking, the next time you hear a claim like this:
1. Is the claim true? Are there, in fact, no neurosurgeons in Illinois south of Springfield? As far as I can tell, this appears to have been an accurate claim — but anyone who spends any time around political debates knows that the claims one hears sometimes bear little resemblance to objective reality. So, its worth asking "how do you know?" The fact that the American Hospital Association issued a undated fact sheet that says there is one neurosurgeon south of Springfield, and President Bush gave a speech on January 5, 2005, stating that there were two neurosurgeons practicing south of Springfield suggests that some additional fact checking might be in order.
2. Even if the claim is true, is it framed in a way that is nonetheless misleading? Might using state borders (no neurosurgeons in Illinois south of Springfield) to define the issue be problematic, when demand for medical services does not necessarily respect those borders? Carbondale, Illinois, where Southern Illinois University School of Law is located, is 176 miles by car from Springfield, and 107 miles by car from St. Louis. If it turns out there are plenty of neurosurgeons in St. Louis, should we care (as much, or at all) that there are no neurosurgeons in Illinois south of Springfield?
3. To what extent is the in-state demand for neurosurgical services being met by other specialists? This question is not applicable to a fair chunk of what neurosurgeons do — particularly in trauma cases — but it is worth asking about access claims regarding many other specialties, where the same or substitute services can be performed by other specialists.
4. How tight is the fit between the remedy and the problem? If we enact a damages cap, will we get more neurosurgeons south of Springfield? How many more? Will they be good neurosurgeons? Could we get too many neurosurgeons south of Springfield?
5. If we are convinced we want more neurosurgeons south of Springfield, Is a damages cap the best way to do that? Would a direct subsidy for neurosurgeons willing to locate south of Springfield be more cost-effective? If we have a fixed amount of $$ to spend on the problem, is it better spent on subsidizing relocation of neurosurgeons, or of patients needing neurosurgery (by subsidizing a system of air ambulances, for example)?
6. What are the other consequences of adopting a damages cap, apart from the effect on the supply of neurosurgeons south of Springfield? What will the effect be on other specialties, and the way in which health care is delivered? What will the effect on patients?
These are the kind of questions that it often makes sense to ask about policy initiatives — particularly ones framed by the use of salient anecdotes, such as "there are no neurosurgeons south of Springfield."
|
|