Ok, so today I will be much shorter, and start right up with our findings. I ended my last post with a bunch of points, including our estimation that the Texas cap will reduce payouts in tried cases by 27%, and settled cases by 18% (assuming no change in the volume and mix of cases). In dollar terms, that corresponds to a reduction of $60M in payouts for tried cases, and $780M in settled cases. (For reasons that the paper outlines, these figures are in 1988$ -- to get to 2008$, multiply by 1.83 -- and you get $110M, and $1.47B.
Whose hide do those savings come out of? Predictably enough, it is claimants with non-economic damages that exceed the cap -- and the greater the percentage of one's award that is non-economic and above the cap, the larger the impact. Payouts in tried cases are larger than in settled cases, and size does matter: 47% of the tried cases (and 18% of the settled cases) have paid non-economic damages that exceed the cap.
Who has paid non-economic damages that exceed the cap? We have demographic information on age, employment status, and whether the plaintiff is deceased or not. The following table shows how payout is affected, in the tried and settled cases, for various groups defined by these categories.
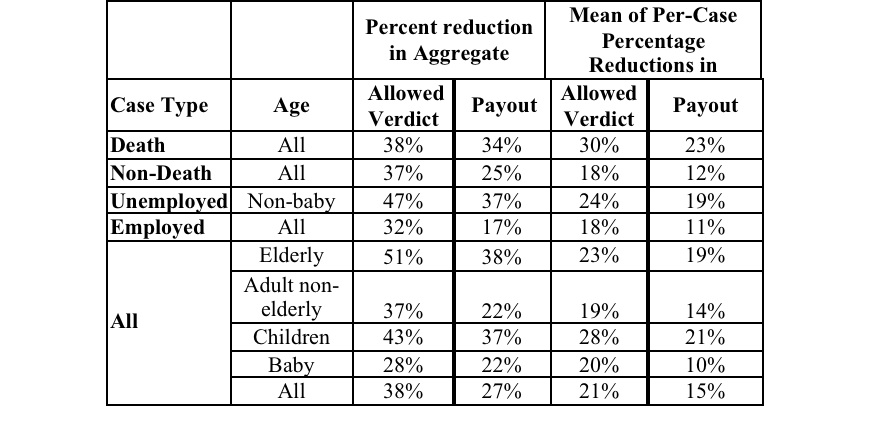
The table shows that some types of cases (death cases, cases in which the plaintiff is unemployed, and cases in which the plaintiff is elderly) had higher aggregate and per-claim reductions in payout. The reduction is larger in tried cases than in settled cases -- which makes sense, since as noted above, the payouts in settled cases are smaller. This means that fewer cases are over the cap, and those that are have a smaller "haircut" from the cap. The differences are statistically significant for per-case mean reductions in tried cases, comparing death with non-death (23% v. 12%), and unemployed with employed (19% v. 11%) -- but not for elderly v. adult-non-elderly (19% v. 14%).
The next table provides a finer breakdown for adult, non-elderly plaintiffs.
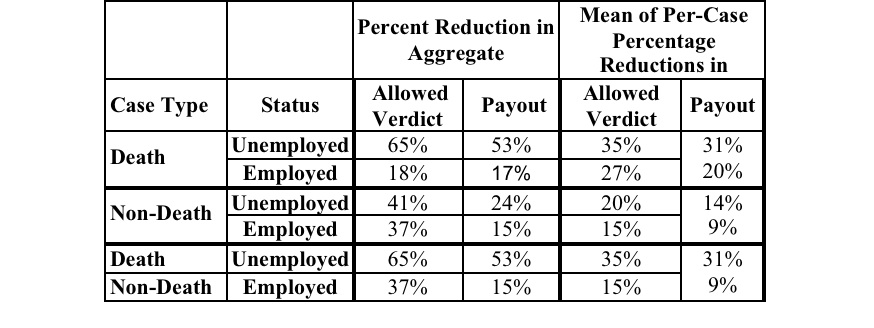
There is a striking gap between the 53% aggregate reduction in payout for unemployed deceased plaintiffs, versus 17% for employed deceased plaintiffs or 15% for employed non-deceased plaintiffs. The gap for unemployed non-deceased plaintiffs v. employed non-deceased plaintiffs is more modest (24% v. 15%). Within the death and non-death groups, the per-case mean differences are not significant -- perhaps due to small sample size, but they become so in the last comparison, between unemployed deceased plaintiffs and employed non-deceased plaintiffs (31% v. 9%).
To summarize, the Texas cap hits hardest those with large non-economic damage awards -- and those plaintiffs are disproportionately likely to be deceased, unemployed, and perhaps elderly.
My next post will address how "tweaking" cap design affects the impact. Stated differently, it will address which of the 31 states has the most severe and least severe cap -- and how a $250k flat cap compares to a $1.75M total damages cap in terms of its impact on payouts.
Related Posts (on one page):
- Damage Caps and Medical Malpractice VII
- Damage Caps and Medical Malpractice Litigation: VI
- Damage Caps and Medical Malpractice Litigation: V
- Damage Caps and Medical Malpractice Litigation: IV
- Damage Caps and Medical Malpractice Litigation: III
- Damage Caps and Medical Malpractice Litigation: II
- Damage Caps and Medical Malpractice Litigation