Washington Monthly‘s Political Animal reports:
An extremely disturbing new study published in the American Journal of Public Health finds that suicides have replaced car accidents as the leading cause of injury-related death in the U.S. This is partly because deaths from automobile accidents are down — that’s the good news.
But the truly catastrophic news is that the suicide rate has increased dramatically: between 2000 and 2009, according to data from the U.S. National Center for Health Statistics, deaths by suicide went up by 15%, and deaths from poisoning increased by a whopping 128%. Moreover, researchers say that many of the poisoning deaths, which are labeled as “accidental,” may actually be intentional. According to the study’s author, Professor Ian Rockett, an epidemiologist at West Virginia University, “Suicides are terribly undercounted; I think the problem is much worse than official data would lead us to believe.” He added “there may be 20 percent or more unrecognized suicides.”
Experts note that much of the increase in poisoning deaths is due to prescription drug overdoses, but none of the reports I found about the study speculate about what psychological, social, or economic causes are behind the spike in suicides. (I was unable to find an online copy of the study itself). But there is strong evidence elsewhere that our disastrous economy may be playing a significant role. Last year, a report by the Center for Disease Control and Prevention found that “[s]uicide rates in the U.S. tend to rise during recessions and fall amid economic booms.” …
The Daily Mail expressed a similar view: “More Americans now commit suicide than are killed in car crashes as miserable economy takes its toll.”
Here’s the problem: While there does seem to be a correlation between the suicide rate and the unemployment rate,
- The “dramatic[]” increase in suicide is visible only when one views 2000 as the base year, and 2000 was the year with the lowest suicide rate in the last 30 years. If one looks back to the 1980s, one sees age-adjusted suicide rates that are higher than they are now (even looking at 2010, which had a higher suicide rate than 2009).
- The increase in suicide rate from 2000 to 2009 (10.44 to 11.77) happened largely from 2000 to 2007 (10.44 to 11.27), before the bad economy kicked in. (The unemployment rate in 2007 was 4.62.) It then increased to 11.61 in 2008, even though the aggregate unemployment rate in 2008 was under 6%, and was under 7% for all the months before December. In the really high unemployment year 2009, it then increased to 11.77, and then to 12.08 in 2010. This means that even if you count 2010, well over half the increase in the suicide rate happened in the years when the economy was strong. This suggests that there’s something else happening that has been increasing the suicide rate, and the increase has only slightly accelerated with the bad economy.
- The numbers I give above refer only to suicides that are reported as such, but if one includes accidental poisonings, the results seem even less connected to the economy: The accidental poisoning rate increased from 4.53 in 2000 to 9.83 in 2007, and from then only to 10.29 in 2009 and 10.63 in 2010; there seems to be a broader trend in the accidental poisoning rate that actually slowed since the bad economy kicked in.
Here’s the graph giving the 1981 to 2010 data, with the fairly smooth blue line indicating suicide, and the much more sharply varying red line indicating unemployment rate. (I looked at the same CDC WISQARS dataset as that used by the study for 1999 to 2010, though without the regressions done by the study; the 1981 to 1998 CDC WISQARS dataset, which seems comparable, and which is also age adjusted to the 2000 demographics; and this Department of Labor dataset for unemployment data. To see the numerical data, see this Excel spreadsheet.)
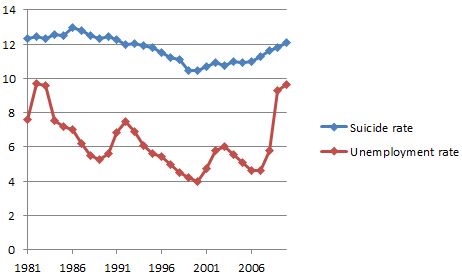
Again, you can see some substantial correlation between suicide and unemployment generally, but you also see some rather sharp divergences, plus (1) the suicide numbers of the last few years being below the 1980s totals, including from the low-unemployment late 1980s, (2) the 2000 to 2009 increase reflecting a trend that began in the low-unemployment years and then at most somewhat accelerated in the high-unemployment years, and (3) 2000 being the base year that most shows an increase in suicide, since it and 1999 were unusually low-suicide years. Or at least that’s what the data suggests to me; please let me know if I’m missing something big here.